This post looks at public data from Ottawa, Ontario, to explore a simple question: What happens to vehicle speeds when speed cameras stop issuing speeding tickets? I highly doubt I’m the first to look at this, but here’s a writeup anyway.
The short version is that speed cameras work: when they stopped sending automatic tickets in Ottawa, Ontario, average speeds at each camera location increased at by between 2% and 20% almost immediately.
Introduction
First, a bit of context about the technology of speed cameras, what the research says about their efficacy, and Ontario politics (sorry).
Speed cameras are pieces of equipment that watch a road and detect vehicles’ speeds. They’re usually stationary and permanent but they can be temporary and mobile. Usually they’re used for “automated speed enforcement” (or ASE), so if they detect a vehicle going faster than the legal speed limit they can detect its license plate and automatically issue a ticket that the vehicle’s owner will receive in the mail.
Folks who research speed cameras and their impacts have consistently found that speed cameras with automatic speed enforcement make vehicles drive slower, which makes roads safer. Don’t take my word for it: a 2026 systematic review that looked at 94 studies from around the world and concluded that “SC [speed cameras] are associated with meaningful reductions in mean speed, speed dispersion, and the proportion of vehicles exceeding posted speed limits” (Amancio et al., 2026).
Despite these benefits, it became illegal to use speed cameras for automated speed enforcement in Ontario, Canada, on November 14, 2025, through Bill 56, the Building a More Competitive Economy Act, 2025. Speed cameras had beeen in use throughout the province for several years, and anecdotally at least they seemed to be working and I personally never heard any serious complaints about them. But Premier Doug Ford insisted that they had to go. His stated reason was that the cameras were too sensitive, although it was also widely reported that members of Ford’s Conservative government cabinet had received nearly two dozen tickets for thousands of dollars Global News, so who can say.
But in a wonderful case of malicious compliance, the City of Ottawa disabled automated speed enforcement but kept the cameras running and kept reporting on vehicle speeds. While we don’t have vehicle-level data, we have very nice monthly summary statistics for each location including mean speed, 85th percentile speed, percent of vehicles in compliance with the posted speed limit. There’s even a column that helpfully identifies whether the entry is pre, during, or post automated speed enforcement! Thank you, City of Ottawa Open Data team and traffic policy people! You are cloaked within the bureaucracy but we know you by your works.
So we have a nice natural experiment with a curated dataset to see what happens when you switch off the automatic ticket system.
Loading & cleaning the data
You can access the data from Ottawa’s open data repository here. I grabbed my data in June 2026, so yours may look different.
You can also get data about camera locations here, with the same caveat that I got mine in June 2026.
Overall the data looks great, and my cleaning process is mostly just standardizing dates and numbers. The one issue I found is that the data says it includes measurements from before ASE was enabled, but I’m not so sure: There are 7 rows with valid pre-ASE data but they all date from before the cameras were installed. They may be from earlier traffic studies, but to be safe I’ll exclude them here.
Table 1: Summary statistics for complicance rates across all speed camera locations, while automated speeding enforcement (ASE) was active, and after it was disabled.
data_type
Mean
SD
Std.Err.
ASE Active
76.6%
11.3%
0.5%
ASE Removed
43.6%
13.5%
1.8%
And a simple ANOVA analysis gives us a P-value of approximately 10−30, which is pretty definitive:
Table 2: Descriptive statistics for overall compliance rates across all speed camera locations, while ASE was active and after it was removed.
term
df
sumsq
meansq
statistic
p.value
data_type
1
54005.68
54005.6849
407.6069
0
Residuals
551
73004.49
132.4945
NA
NA
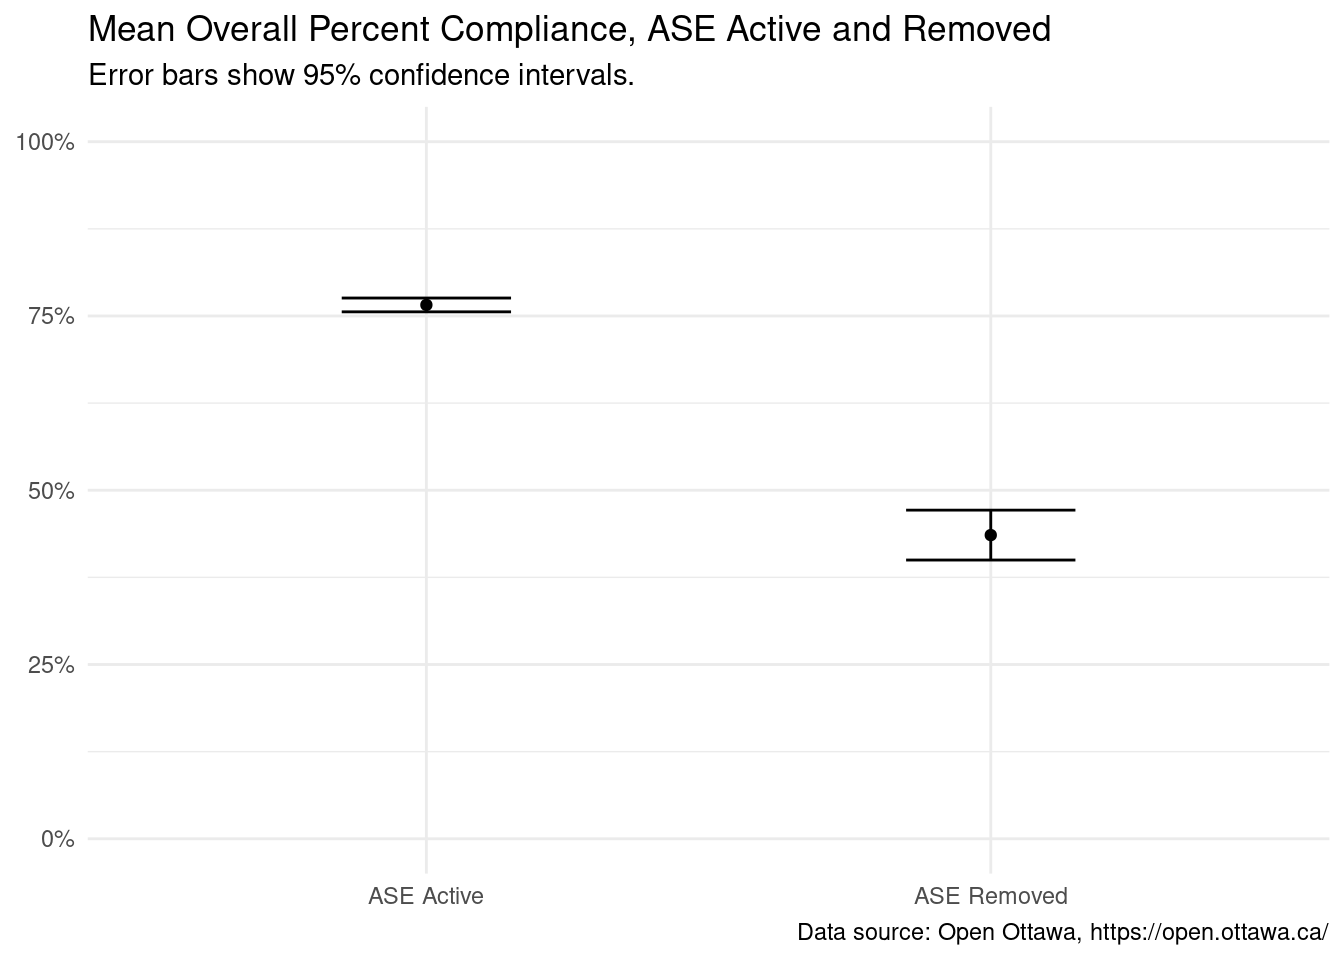
And if we plot the mean compliance rates during and after ASE with 95% confidence intervals, they sure look different:
Show the code
compliance_df |>ggplot2::ggplot() +ggplot2::geom_point(mapping = ggplot2::aes(x=.data$data_type,y = .data$mean_pct_compliance )) +ggplot2::geom_errorbar(mapping = ggplot2::aes(x = .data$data_type,ymin = .data$mean_pct_compliance -1.96* .data$std_err_pct_compliance,ymax = .data$mean_pct_compliance +1.96* .data$std_err_pct_compliance,width =0.3 ) ) + ggplot2::theme_minimal() + ggplot2::scale_y_continuous(labels = scales::label_percent(scale =1) ) + ggplot2::labs(x =NULL, y =NULL,title ="Mean Overall Percent Compliance, ASE Active and Removed",subtitle ="Error bars show 95% confidence intervals.",caption="Data source: Open Ottawa, https://open.ottawa.ca/" ) + ggplot2::coord_cartesian(ylim=c(0,100))
Figure 1: Point estimates and 95% confidence intervals for overall mean compliance rates across all speed camera locations, while ASE was active and after it was removed.
So, yes, turning off AES decreased average speed-limit compliance by around 32%, from 74.8% to 42.8%.
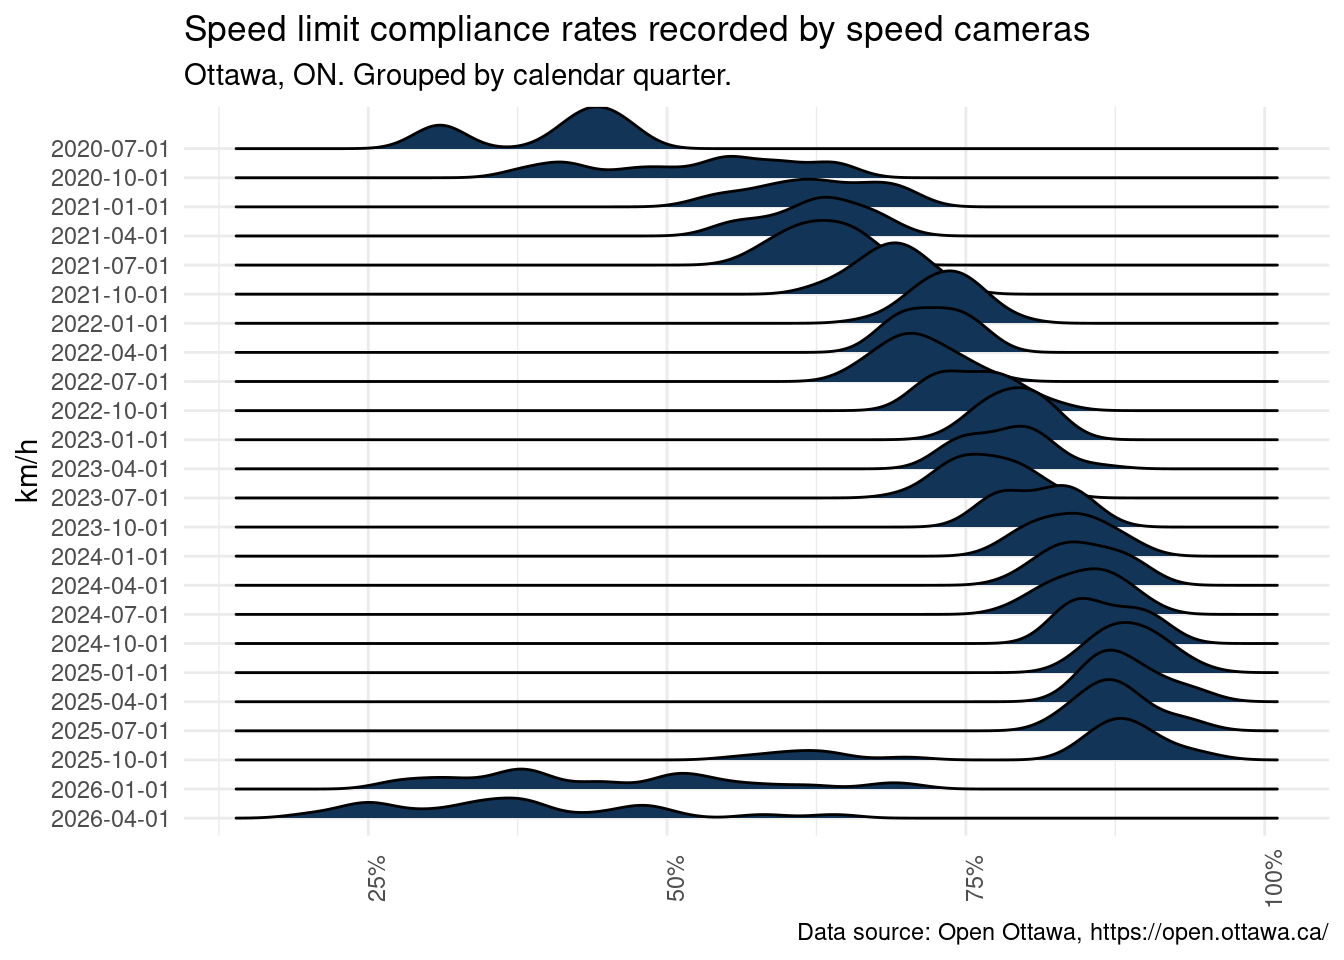
Finally, we can visualize how the distribution of compliance rates changed over time using a ridge plot.
Results for each fiscal quarter are presented on one row, and values farther to the right show higher compliance rates. We see that rates were pretty spotty at first in 2020, but they quickly improved once AES began. And then we see a steep drop beginning in Q3 2025 when they shut AES off.
Speed changes at different cameras
What about speed changes at specific cameras? We can calculate an overall increase in km/h, although this won’t always be comaprable since different cameras are in locations with different speed limits, so we’ll also calculate percentage increases.
E001 - Longfields Dr. between Highbury Park Dr. and Via Verona Ave.
37.1 km/h
41.7 km/h
4.6 km/h
12.4%
E002 - Innes Rd. between Provence Ave. and Trim Rd.
56.4 km/h
61.7 km/h
5.3 km/h
9.3%
E003 - Bayshore Dr. between Woodridge N Cres. And Woodridge S Cres.
36.2 km/h
43.5 km/h
7.3 km/h
20.2%
E004 - Katimavik Rd. between Castlefrank Rd. and McGibbon Dr./Sewall Way
38.0 km/h
43.0 km/h
5.0 km/h
13.1%
E005 - Watters Dr. between Charlemagne Blvd. and Roberval Ave.
37.4 km/h
43.7 km/h
6.3 km/h
16.9%
E006 - Ogilvie Rd. between Appleford St. and Elmlea Gate
46.9 km/h
48.0 km/h
1.1 km/h
2.3%
E007 - Smyth Rd. between Haig Dr. and Edgecomb St.
45.2 km/h
50.3 km/h
5.1 km/h
11.3%
E008 - Meadowlands Dr. W. between Winthrow Ave. and Thatcher St.
37.1 km/h
42.3 km/h
5.1 km/h
13.8%
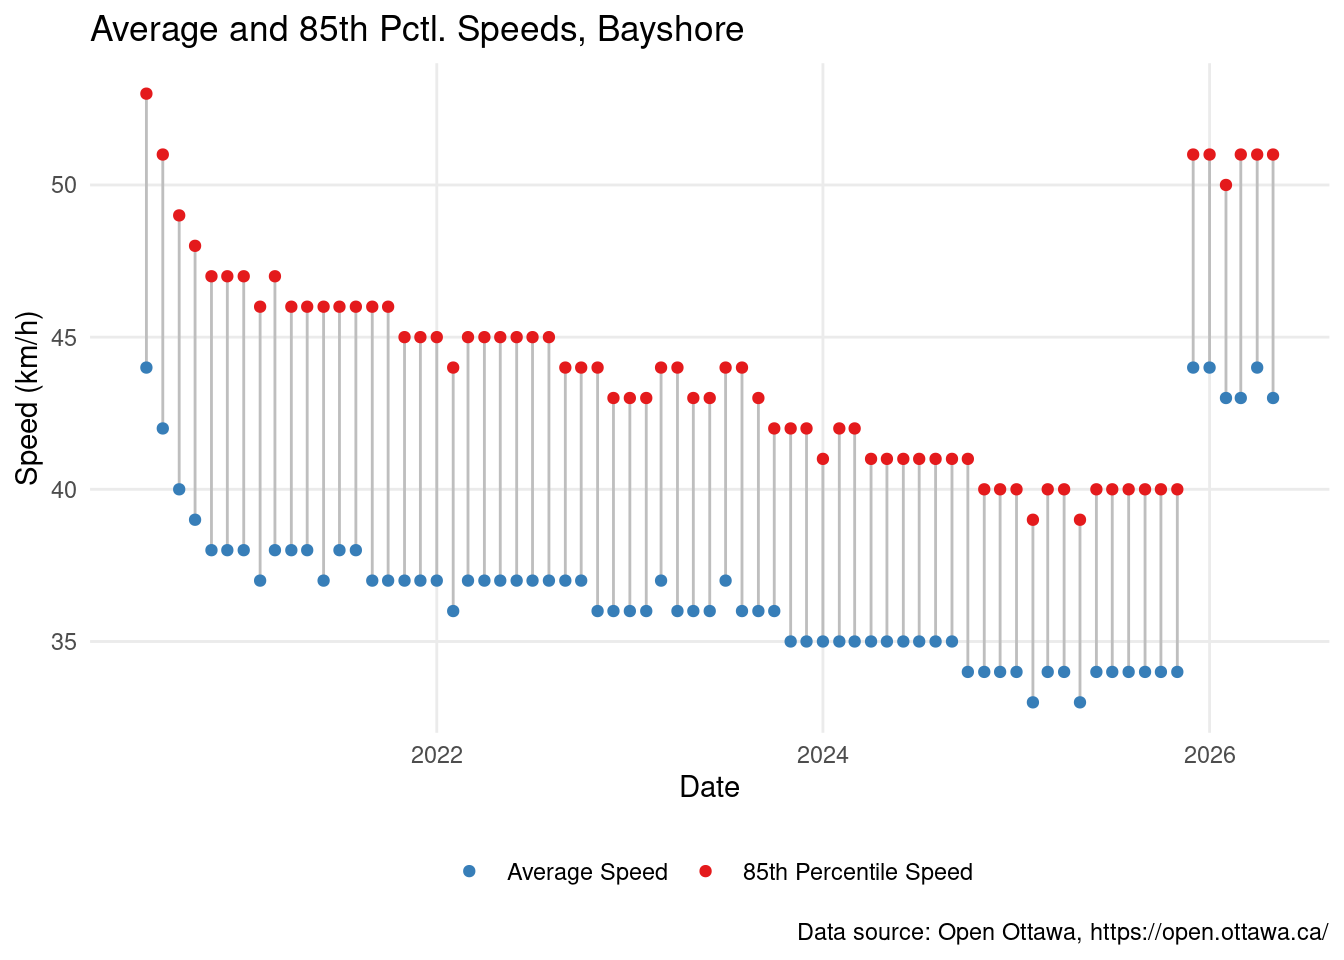
We see that every single camera recorded an increase in average speeds. Bayshore had the largest absolute and percentage increase, so let’s take a look at it in more detail. In the following diagram, blue circles show the average speed for each month and red circles show the 85th percentile speeds–so 15% of drivers went at least this fast.
Figure 3: Average and 85th-percentile speeds recorded on Bayshore Dr. at Woodridge Cresc, 2020-2026.
The jump in November 2025 is quite remarkable! Not only did the average speed jump from 34ish to 44ish km/h, but the 85th percentile speed jumped from 40km/h to over 50km/h.
What have we learned?
Well, speed cameras work: drivers sped up when the speed cameras stopped giving tickets. And in some cases they sped up a lot.
If you believe the Canadian Association of Road Professionals, this means that a pedestrian’s average odds of surviving an impact on Bayshore dropped from around 90% to around 60%, and if you’re hit by one of those 85th percentile drivers you only have a 20% chance of surviving.
We’ll learn more as new data comes in–for example, I haven’t done any seasonal analysis here, and with only a few months of post-ASE data it’s possible that the story will change slightly. More morbidly, we’ll also get new collision data that could shed light on actual accidents, and if there was an increase in number or severity after they turned off AES. A more sophisticated analysis would probably also not lump all values into pre/post like I’ve done.
Please drive safely, whether or not anyone is watching!